Becoming familiar with the elements of a map makes it easy to switch between different map types and become comfortable with reading and interpreting a large amount of data.
In general, maps contain a grid by which points can be referenced, a scale bar for relating the map to the physical world again, an indication of which direction north is and a key to determine what’s what on the map. It also contains a title and credits to the map maker, projection and geographic data used to create the map. Some maps have locators and insets.
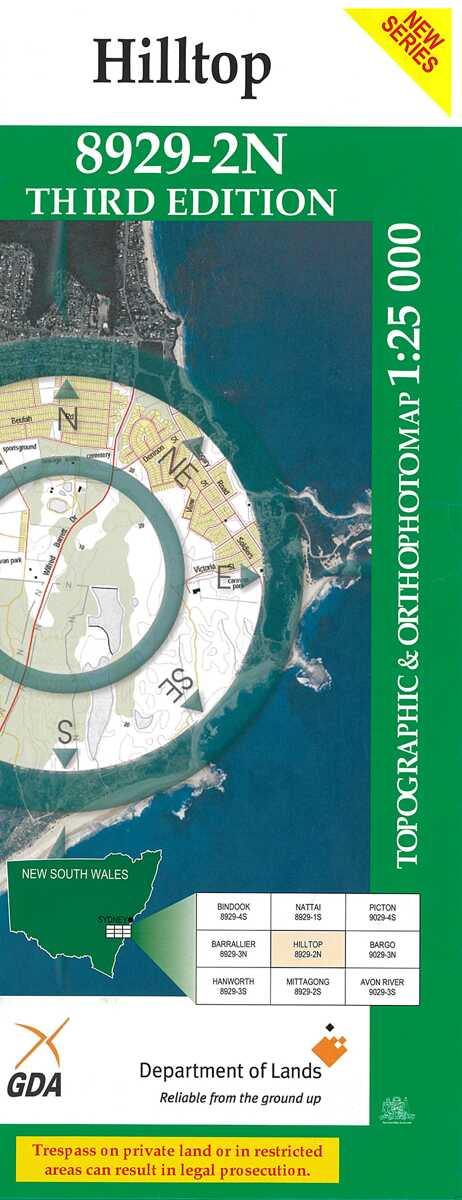
All maps contain a title in a large font that makes the map easy to identify.
In a city, it is quite simple to find a location as the streets are named and the buildings have numbers. The only thing needed is the address. However, locating places in the bush is harder because it’s not a regular daily activity. A uniform referencing system has been developed to help, and now anyone in any location around the world can accurately explain where they are to someone else.
There are the two major coordinate systems that are useful to know for recreational purposes. These are the two main sets of grid lines seen on most topographic maps: (i) the latitude and longitude system and (ii) the Universal Transverse Mercator (UTM) system.
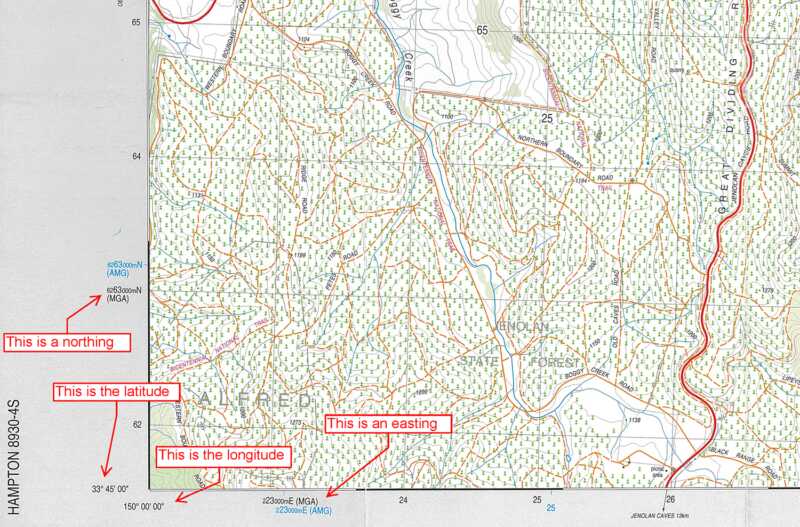
With either system, it’s possible to communicate a location to someone else. For latitude and longitude, the system uses degrees, minutes and seconds. These are the radial positions of lines on a sphere based on a reference point (usually Greenwich, England). For UTM it’s based on a coordinate grid (Eastings and Northings, in metres), although units aren’t included when quoting a grid reference in UTM.
Latitude and longitude lines
Latitude and longitude lines divide the earth into a grid of circular segments: latitude lines are parallel to the equator and run horizontally around the earth. The equator is at zero degrees (0°), and lines run either side from 0° to 90° both north and south. Longitude lines are perpendicular to the latitude lines with 0° running through Greenwich, England. A location is given latitude first, followed by longitude in degrees, minutes and seconds. For instance, Sydney is 33°52.071′ S, 151°12.4392′ E. The S shows that it’s in the southern hemisphere, and E stands for how far East the point is relative to the prime meridian at Greenwich.
The Universal Transverse Mercator (UTM)
The Universal Transverse Mercator (UTM) system divides the earth into a perpendicular set of grid lines measuring surface distances in metres. This system reduces the complexity of transferring a location on a spherical surface to a flat surface (i.e. 2D map).
A UTM position is given by a UTM zone followed by an Easting and Northing. Each UTM zone is 6° wide, and Greenwich England is the reference point. For example, Sydney is in the UTM Zone 56H, and the centre of the city is at UTM Northing 6,252,359.77, and UTM Easting: 334,895.26.
On NSW topographic maps, UTM grid lines are drawn and labelled. Latitude and longitudes are written at the edge of the map area, so it’s possible to locate grid references in terms of degrees, minutes and seconds.
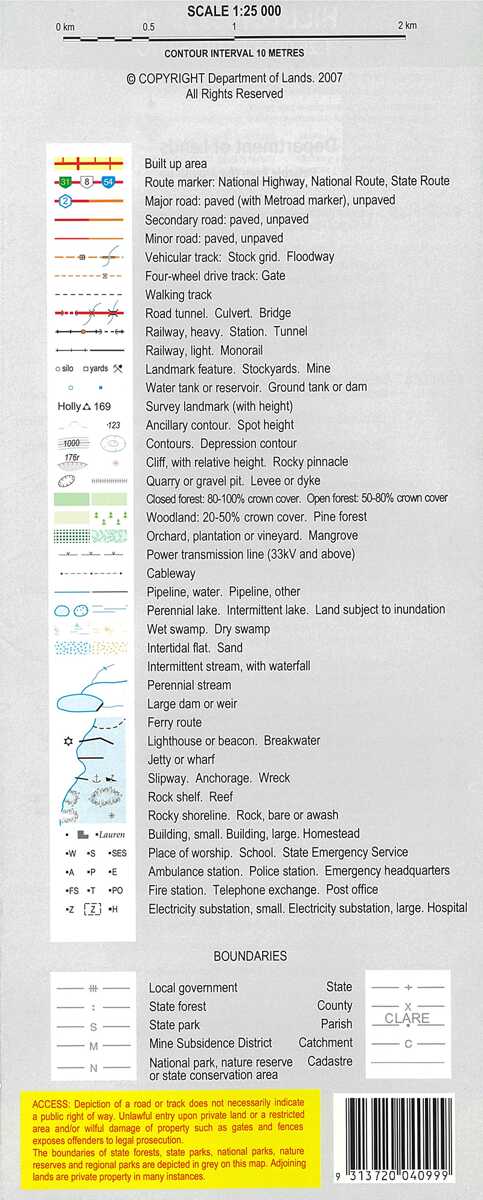
The scale of a map provides a way of comparing what the map represents in terms of the actual distance on the ground.
On NSW topographic maps, the scale of the map is a ratio (e.g. 1:25,000 or 1:100,000), and the scalebar is a ruler divided into kilometres and miles. On a map scaled at 1:25,000, 4 cm on the map equals 1 km on the ground. More literally the ratio says that 1 cm equals 25,000 cm on the ground or 250 m.
For on-track day walks, bushwalkers might be able to get away with a 1:100,000 scale map. But for harder walks and walks off-track, then bushwalkers usually prefer 1:25,000. A 1: 25,000 scale is detailed enough for navigating off-track, and most trips fall over one or two maps.

All maps are orientated to enable the user to related physical on ground features to the map. Most topographic maps used for bushwalking are orientated to true north, which means that the map aligns with the true north/south meridians that connect to the north pole. By contrast, the compass needle points to magnetic north, so when taking bearings on and off the map, the user needs to take the difference between the two norths (magnetic declination) into account.
A map key or legend identifies symbols on the map and indicates what features they represent. It’s usually located in a separate box at one corner of the map and contains colours, symbols, signs or other notation to help the reader interpret the map.
On topographic maps, the key allows users to distinguish between constructed features, natural relief features, vegetation and private vs. public areas.
Map credits inform the reader on the geographical data and projections used to create the map.
Credits include:
- Cartographer’s name
- Date of map creation
- Source and date of geographic data
- Projection used
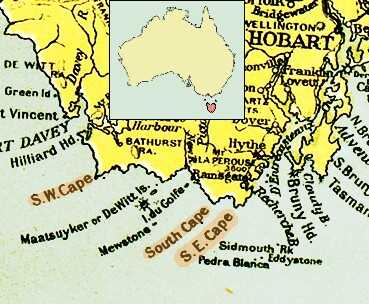
A locator map connects the area of the map to a bigger or more recognisable (and smaller) scale. For example, Tasmania is often shown in the context of mainland Australia on a locator map. By contrast, insert maps give more detail about a particular area using a larger scale.